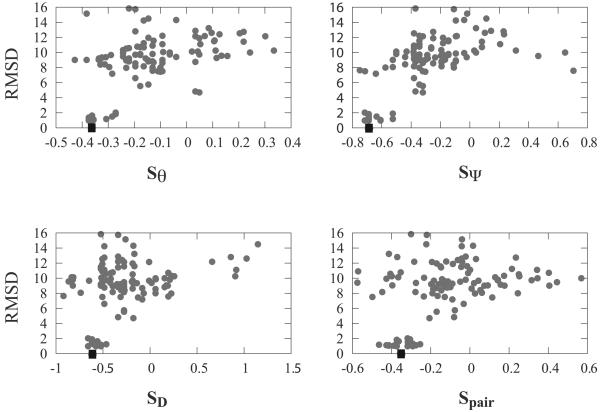
Figure 9. Score-RMSD scattered plots for the 4ubpA decoy set analysed with four statistical potentials specific to their αβ2 motifs.
These four potentials capture the azimuthal angle between the helix and strands (θ), the elevation angle between the plane containing the sheet and the helix (ψ), the distance D between the helix and the sheet, and the propensity of the aminoacid pairs in the interface between the helix and the strands (PR). In all four panels, the native protein is shown as a square.

