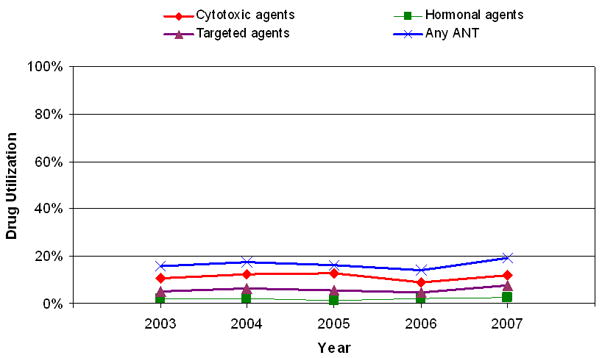
FIGURE 1. Frequency of antineoplastic therapy (ANT) use by year.

The frequency of cytotoxic, hormonal, targeted and any ANT agent use is plotted between 2003 and 2007. The P-values were 0.93, 0.64, 0.30 and 0.61 (chi-square test for trend), respectively.
