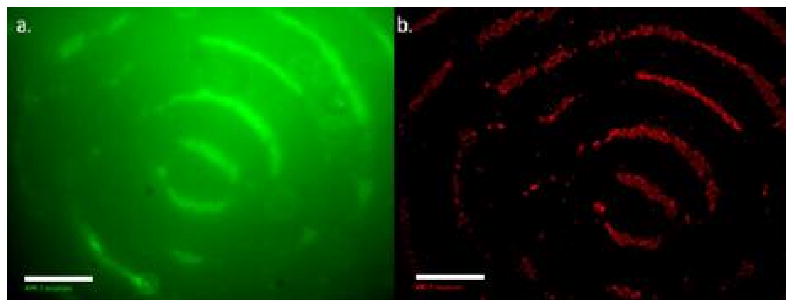
Figure 4.

Fluorescent images of live (a) and dead cells (b) after acoustic focusing in a PEGDA solution, following by UV light photopolymerization. The frequency of the sound field was 2.32 MHz and the cell initial concentration was 5 × 10⁶ cells/ml. The LIVE/DEAD assay was applied 40 hr after encapsulation and incubation. Scale bar is equal to 500 μm.
