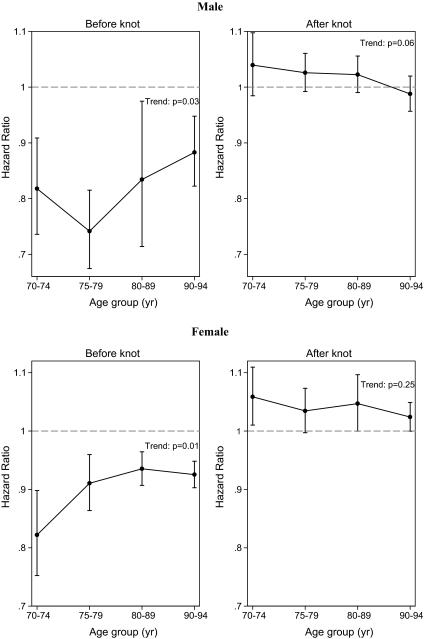
Figure 2.
Linear trend analysis for the hazard ratio with an increment of 1.0 in body mass index (BMI) according to age groups having a low (below knot) or high (above knot) BMI for each gender. The hazard ratios are from the separate linear spline models of the four age groups. The bars represent 95% confidence intervals. The p value refers to a linear trend test. The graph on the left shows that the association between mortality and low BMI decreases with advancing age, and the graph on the right also shows that the association between mortality and high BMI decreases with advancing age.

