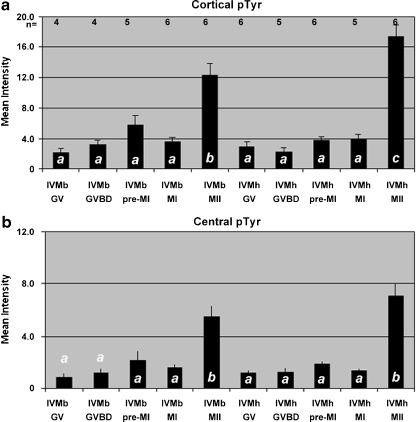
Fig. 4.
Levels of pTyr proteins is increased significantly at metaphase-II. The same oocytes used for the linescan analysis were used for statistical comparisons of average fluorescent intensity. This included the cortical (a) measurements from linescans seen in Fig. 3 plus the central cytoplasm (b), ie that region of the cytoplasm not included in the cortical scans & not including the region of the nucleus and/or spindle. A significant rise in pTyr levels was detected in both the cytoplasm and the egg cortex. Cortical pTyr levels were higher in oocytes matured in IVMh than IVMb (bars labeled with different letters (a, b, c) are significantly different, P < 0.05)

