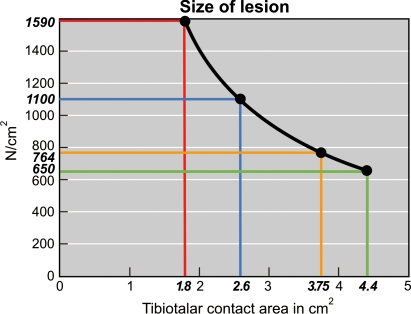
Fig. 3.
Graph showing load in relation to tibiotalar contact (black line). The green line represents the average tibiotalar contact area of 4.4 cm² for a 75-kg person during the stance phase of walking. The blue line represents the same person with a tibiotalar contact area diminished by 42% to 2.6 cm², as would occur after an ankle fracture with 1 mm of lateral displacement of the talus and fibula. The red line represents the same person with a tibiotalar contact area diminished by 58% to 1.8 cm², as would occur after an ankle fracture with 2 mm of lateral displacement of the talus and fibula. The yellow line represents a person weighing 75 kg with an OD of the talus measuring 0.65 cm2; the average load on the remaining cartilage is increased from 650 to 764 N/cm²

