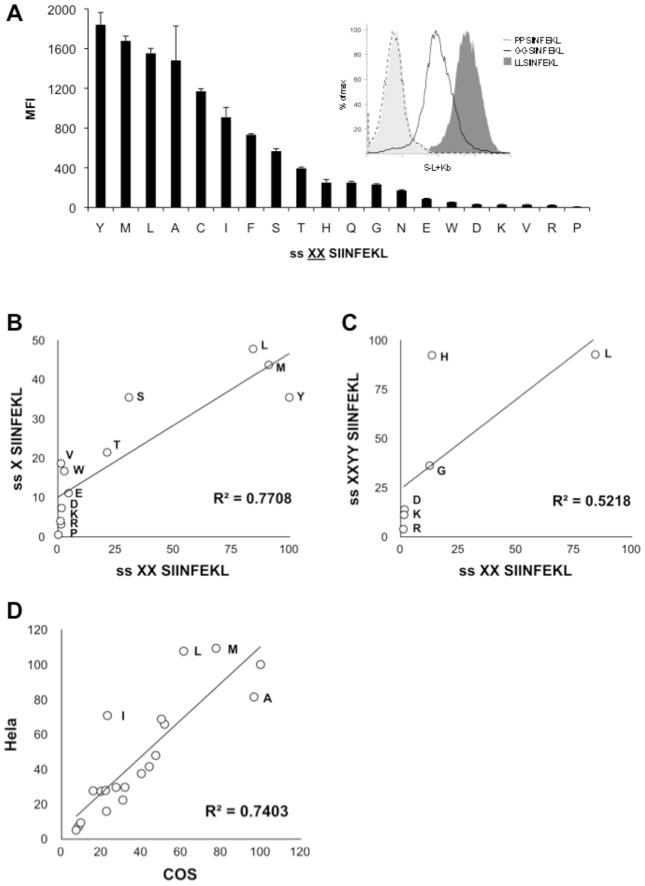
Figure 2. Antigen presentation in HeLa-Kb-ICP47 cells transfected with ER targeted S-L precursors.
(A) Cells were transfected with ER targeted XXS-L (ss XXS-L, where X represents one of the twenty amino acids). After 24 hrs, cells were stained for S-L + H-2Kb complexes with 25.D1.16. Graphs represent the average mean fluorescent intensity (MFI) of two independent transfections. Error bars represent the difference within each group. In the inset, FACS showing cells stained with 25.D1.16 following transfection with ss GGS-L, ss PPS-L and ss LLS-L; background, dark shaded histogram. (B) Correlation between presentation of S-L in cells transfected with ss XS-L and ss XXS-L. (C) Correlation between presentation of S-L in cells transfected with ss XXYYS-L and xx XXS-L. (D) Correlation between presentation of S-L in Hela-Kb and COS-Kb transfected with ss XXS-L.

