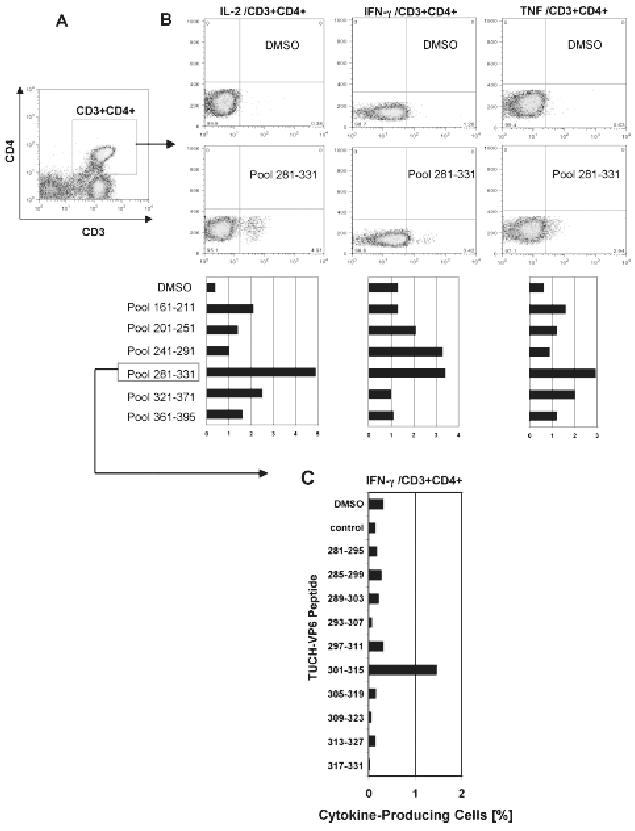
Figure 2.

Rotavirus VP6 epitope mapping was performed with peripheral blood cells collected at peak of virus infection (PCD 7) from GA02 macaque. Stimulation was performed in vitro with overlapping VP6 15-mer peptide pools corresponding to the TUCH rotavirus (Maecker et al. 2001; Jaimes et al. 2005). Following staining with appropriate FACS antibodies, analysis of intracellular cytokine production was performed (Sestak et al. 2004; Pahar et al. 2006). Gating was done through populations of CD3+CD4+ T cells (A). The amino acid sequence ranges are shown for each pool (B). Highest production of IL-2, TNF and IFN-γ cells was found upon stimulation with the VP6281–331 pool although some cytokine production was also seen upon stimulation with other VP6 pools, primarily for IFN-γ after stimulation with the VP6241–291 peptide pool. DMSO values indicate baseline levels. Individual peptides from the VP6281–331 pool were used to stimulate peripheral blood cells collected at PCD 14 for their ability to induce production of IFN-γ (C). The highest IFN-γ production following stimulation with VP6301–315 peptide is shown (C).
