Figure 4.
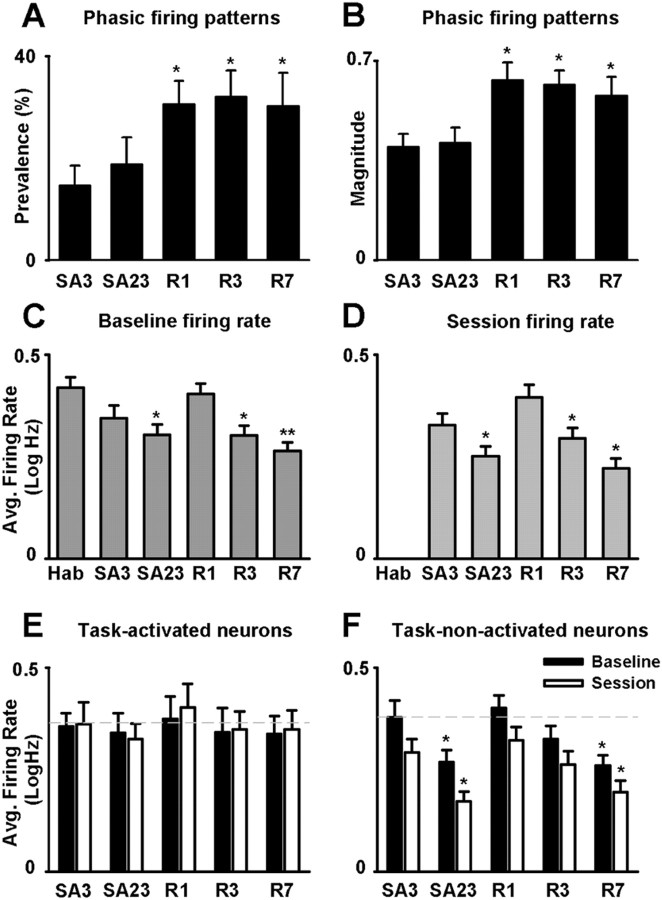
Stage-dependent and activity-dependent changes in NAc firing across the initial nicotine SA, abstinence, and reexposure stages. A, Average percentage of recorded neurons (i.e., per animal) that exhibited a phasic-increase firing pattern time-locked to the nicotine-reinforced lever press (i.e., prevalence percentage) is plotted as a function of recording day (i.e., SA3 and SA23 of initial SA session; and R1, R3, and R7 of reexposure). B, Average magnitude of the phasic-increase firing pattern time-locked to the nicotine-reinforced lever press is plotted as a function of recording day (i.e., SA3 and SA23 of initial SA; and R1, R3, and R7 of reexposure). The calculation of magnitude is described in Materials and Methods. In both A and B, the asterisk (*) denotes a significant difference, relative to the 3rd and the 23rd days of SA (p < 0.05). C, D, Average baseline (C) and SA (D) firing rates [i.e., average log10(x + 1), abbreviated log Hz] are plotted as a function of recording day (i.e., Hab, SA3, and SA23 of initial SA; and R1, R3, and R7 of reexposure). C, The single (*) and double (**) asterisks denote a significant difference relative to habituation day with p < 0.05 and p < 0.01, respectively. D, Asterisk (*) denotes a significant difference relative to SA3. E, F, Average baseline and SA firing rates [i.e., average log10(x + 1), abbreviated as log Hz] of task-activated (E) and task-nonactivated neurons (F) are plotted as a function of day (i.e., SA3 and SA23 of initial SA; R1, R3, and R7 of reexposure). The asterisk (*) denotes a significant difference relative to SA3 (p < 0.05). Error bars indicate SEM.

