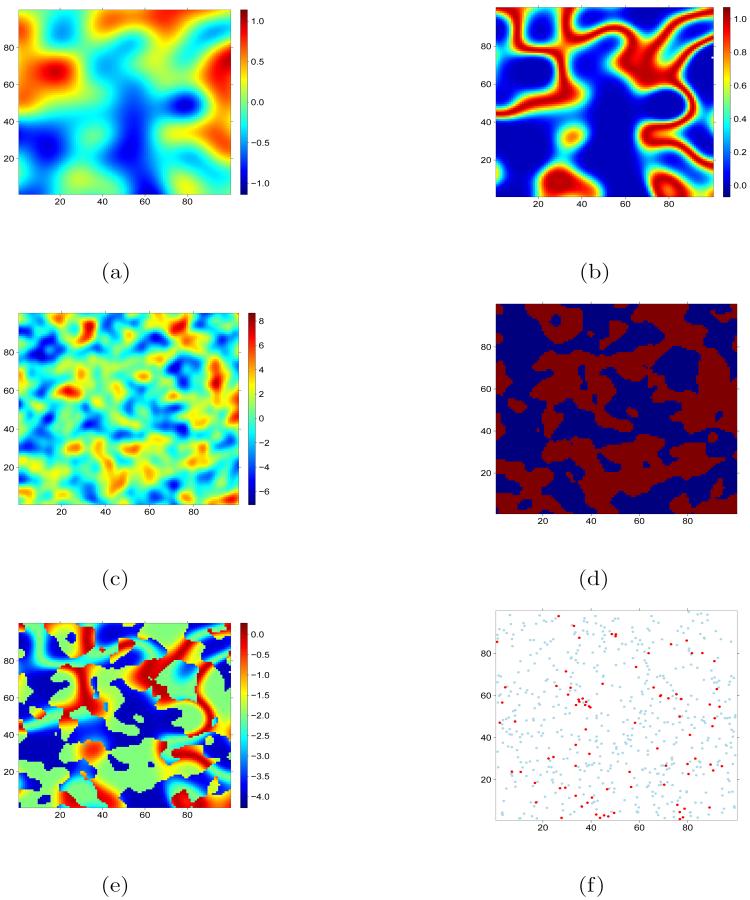
Figure 1.
Dataset generated for simulation study 1. The first GRF (a) was transformed by the HSC to derive habitat suitability (b). The second GRF (c) was split at the 50% quantile to provide and indicator map of where model 1 (blue) and model 2 (red) operate. A map of g(μ) (e) was derived from (b) and (d) and used to simulate observed data (f).

