
Figure 1.
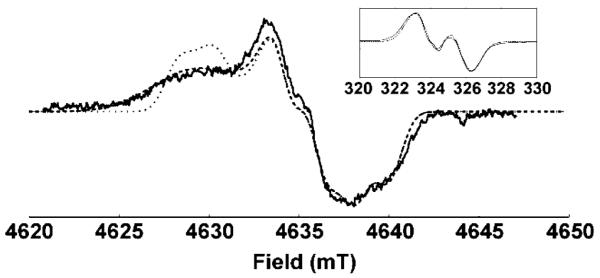
Derivative of the HF echo-detected EPR absorption spectrum of 2H-exchanged WD1 (–), and simulations with (- - -) and without (···) a distribution in gX. Experimental parameters: 9 K; EPR frequency = 130.00 GHz; pulse widths ) 50 ns; tau = 120 ns; repetition rate = 100 Hz; shots per scan = 100; total scans = 7. Inset: X-band EPR spectrum (–) and simulations with (- - -) and without (···) a distribution in gX. Experimental parameters: 77 K; EPR frequency = 9.101 GHz; power = 0.5 mW; modulation amplitude = 0.25 mT; time constant = 1 s; scan time = 4 min; total scans = 4.