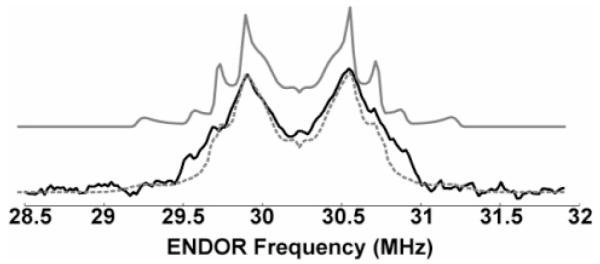
Figure 2.

Mims HFENDOR of 2H WD1. Experimental spectrum (–) and simulations with (- - -, gray) and without (–, gray) a distribution in hydrogen bond length (see text). Experimental parameters: 7 K; EPR frequency = 130.00 GHz; magnetic field = 4635.8 mT; EPR pulse widths = 40 ns; ENDOR pulse width = 20 ms; tau = 100 ns; T = 21 μs; repetition rate = 100 Hz; shots per scan = 30; total scans = 1320; RF power output ~1 kW.
