
Figure 2.
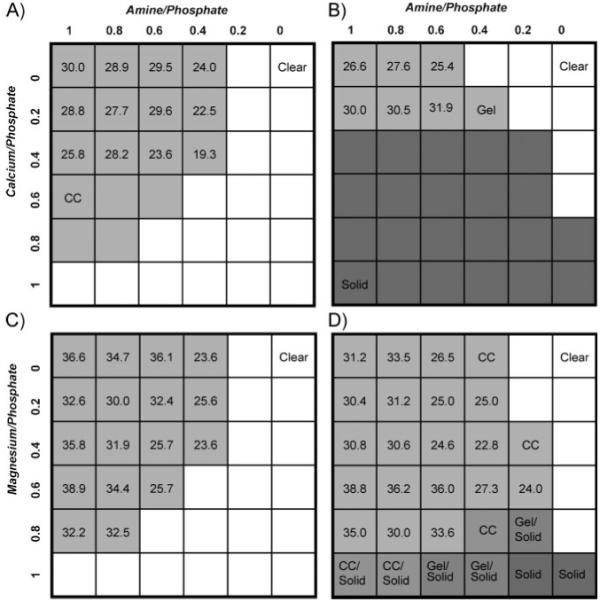
Phase diagrams of polyphosphate–gelatin–divalent cation mixtures. The top axis represents the molar ratio of amine sidechain to phosphate sidechain. The left axis represents the molar ratio of divalent cation to phosphate sidechain. A) Ca2+ compositions, pH 5.0. B) Ca2+ compositions, pH 7.4. C) Mg2+ compositions, pH 5.0. D) Mg2+ compositions, pH 7.4. The total concentration of copolymers in each mixture was 5.0 wt%. Soluble compositions are represented by white squares, compositions that condensed into complex coacervates are represented by light grey squares, compositions that formed gels or hard solid precipitates are represented by darker grey squares. The numbers in the light grey squares are the concentrations (wt/vol %) of the complex coacervate phase. Grey squares without numbers contained complex coacervates, but with volumes too low to allow accurate measurement of the concentration. The Mg2+ solid phases were softer and more gel-like than the Ca2+ solids.