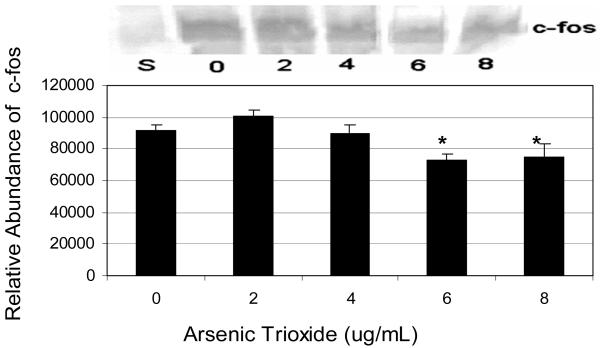
Figure 3.
Expression and relative abundance of c-fos in human leukemia (HL-60) cells exposed to arsenic trioxide. HL-60 cells were treated with different doses of arsenic trioxide, and Western blot and densitometric analyses of c-fos expression were performed as indicated in the Materials and Methods. α-tubulin expression was used to assess equal lane loading. Inset shows a representative Western Blot analysis. Bars represent c-fos relative abundance. Each point represents the mean value and the standard deviation of three experiments. * Significantly different from control (0 μg/mL), p < 0.05.

