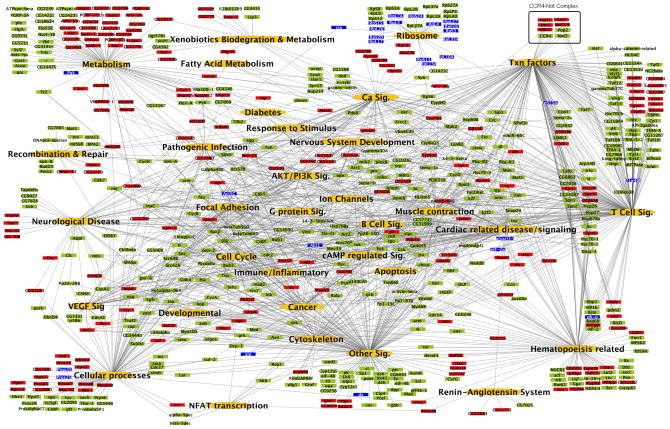
Figure 2. A global network of heart function.
The systems network includes data from the significantly enriched Drosophila KEGG and mouse and human KEGG and C2 data sets. Pathways and gene sets from the same biological processes were grouped into common functional categories. Green nodes represent statistically enriched functional categories of pathways; red nodes represent direct primary fly RNAi hits; light red nodes represent their first degree binding partners; and blue nodes indicate genes that were scored as developmentally lethal in our Drosophila heart screen. Lines indicate associations of the genes to the appropriate functional category. All KEGG pathways and selected C2 gene sets have been represented in the systems map. See also Tables S3–S5.

