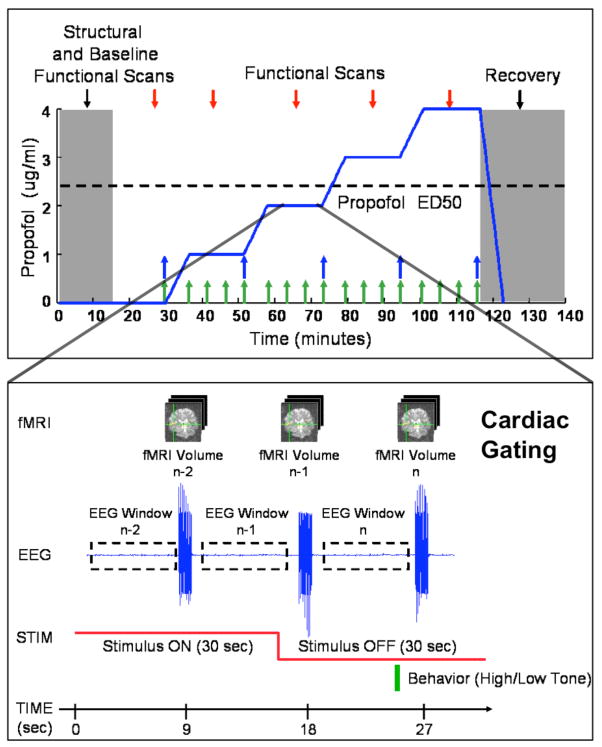
Figure 1.
Study protocol diagram, showing propofol effect-site target concentrations (top), propofol blood sampling (top, green arrows), PCO2 blood sampling (top, blue arrows), “sparse-sampled” fMRI data acquisition paradigm (bottom), EEG windows (bottom), auditory stimuli with both 40 Hz noise bursts (bottom, red line) and behavioral task (bottom, green bar).

