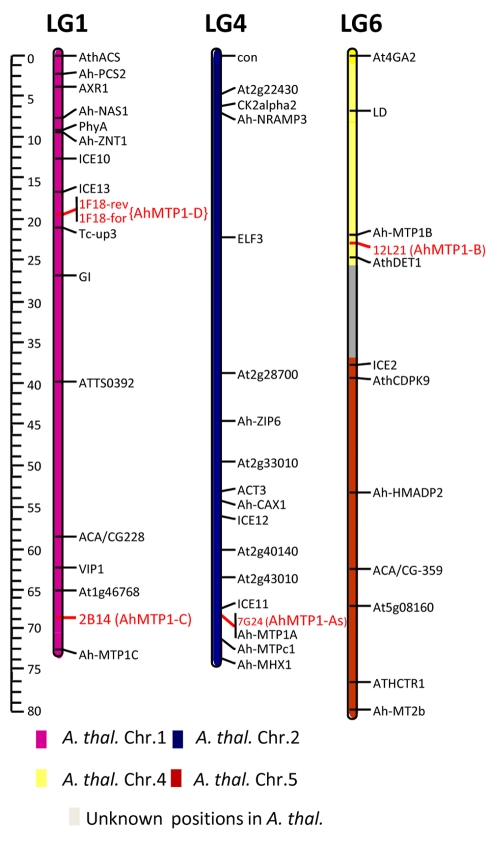
Figure 2. Mapping of the AhMTP1 paralogues on the A. halleri × A. lyrata petraea BC1 linkage map.
The mapping was performed from the analysis of 199 plants and the four parents of an A. halleri × A. lyrata petraea BC1 population. Positions of BAC clones 7G24, 12L21, 2B14, and 1F18 that harbour the AhMTP1-A1 & -A2, AhMTP1-B, AhMTP1-C, and AhMTP1-D paralogues, respectively, are indicated in red letters (1F18rev and 1F18for are two independent markers). The other markers presented on the map have been previously described [20]. Only linkage groups (LG) 1, 4, and 6 of the A. halleri genome are shown. Colours of the bars representing the three linkage groups refer to the conserved synteny between the A. halleri and the A. thaliana genomes as inferred [22]. The regions showing no conserved synteny with A. thaliana are indicated in grey colour. The map was constructed using Joinmap 3.0. The scale to the left of figure represents centi-morgan distances.

