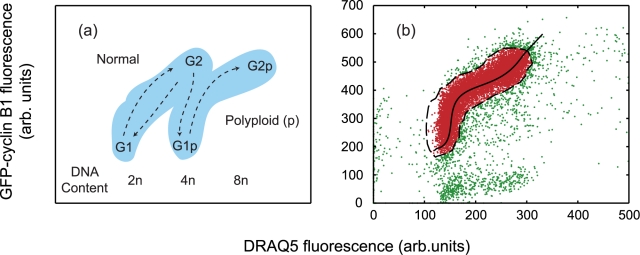
Figure 1. Plots indicating cell pathways through the cell cycle.
(a) A schematic indicating cell cycle routing of cells treated with ICRF-193 in fluorescence space (GFP-cyclin B1 signal as a function of DRAQ5 signal). In control conditions U-2 OS cells divide and remain in normal cycle (representing the proliferative fraction), with ICRF-193 treatment the U-2 OS cells continue to cycle however they bypass mitosis to enter a polyploid cycle (p) (representing the non-proliferative fraction). (b) Segmentation of experimental flow cytometry data representing molecular expression and DNA content used to initialise the CPM. Experimental data at texpt = 0: experiment non-gated data (green and red markers), experimental gated data/initial virtual population (red markers) and the dashed black line refer to the contour defining the gated data. The solid black line indicates the best representation of the fitted population (see text).

