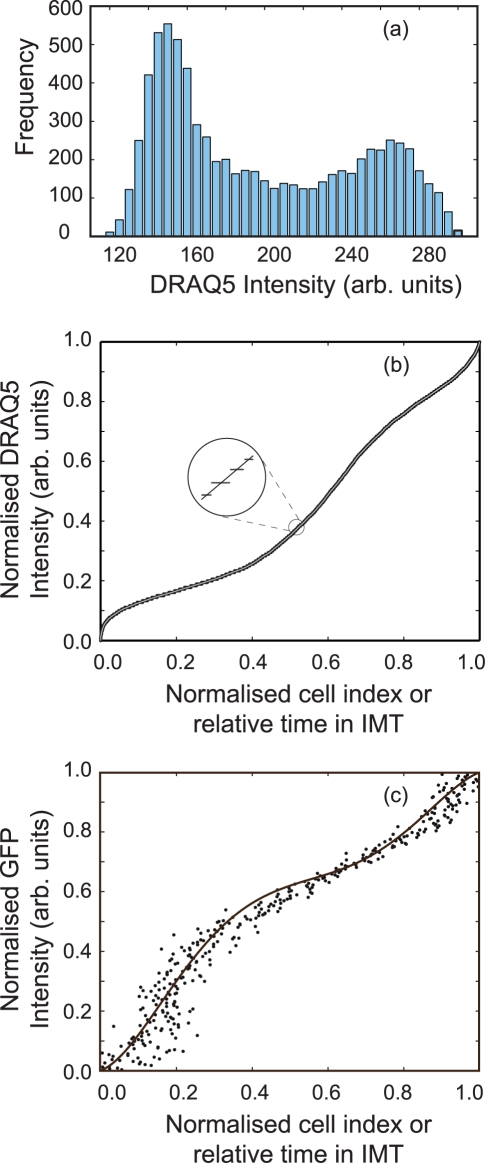
Figure 3. Comparison of traditional analyses of static flow cytometric data and to that used to develop dynamic data analysis.
(a) Displays the fluorescent frequency histogram of the DRAQ5 intensity, plots (b) and (c) graphically illustrate how the median DRAQ5 and GFP cyclin-B1 fluorescence signals vary as a function of a normalised intermitotic time (light grey and blue lines respectively. Insert: plot (b) - magnification of the polynomial fit to the frequency histogram of the DRAQ5 intensity.

