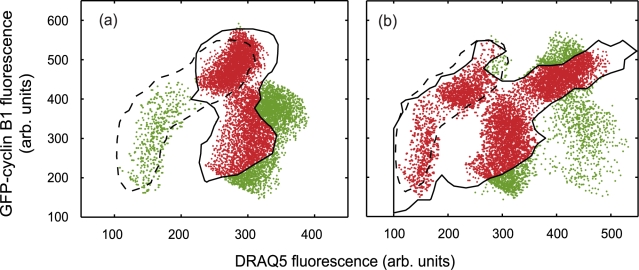
Figure 6. Simulated vpopulation at (a) 24 and (b) 42 hours respectively.
The red shaded areas are virtual cells that lie within the respective experimental gated contours shown in Figures 6(b) and (c), the green shaded points are simulated data lying outside of these contours. Also indicated is the gated, time zero experimental data set contour (black dashed line).

