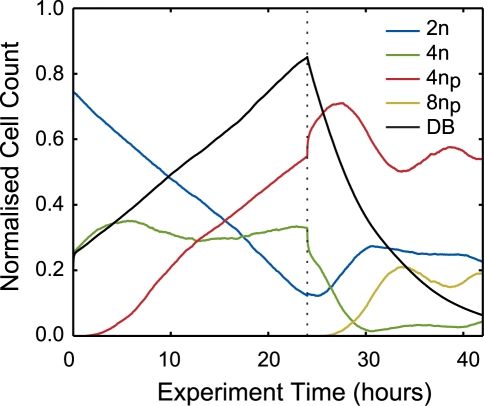
Figure 7. The normalised virtual cell count throughout the time-course of the experiment.
The blue, green, red and yellow curves indicate the fraction of virtual cells in the 2n, 4n, 4np and 8np phases of the cell cycle respectively. In addition, the fraction of virtual cells drug blocked throughout the simulated experiment is indicated by the black curve.

