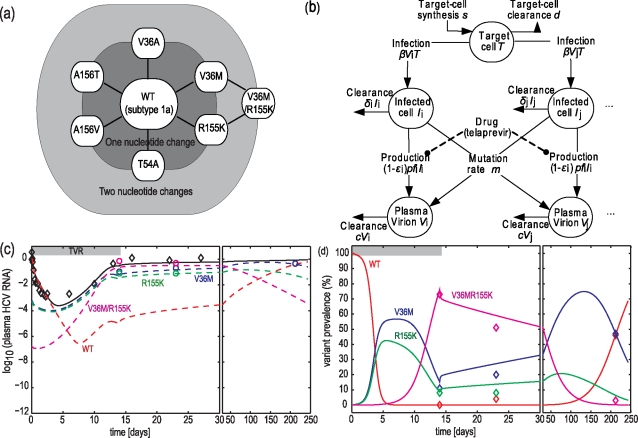
Figure 1. A multi-variant viral dynamic model to quantify response to telaprevir treatment.
Panel a, Superset of HCV genotype 1a variants uncovered in subjects dosed with telaprevir. Each node represents a variant of which the amino acid mutation is printed. Only variants detected in ≥5 subjects are shown. Variants were within 2 nucleotide changes from wild-type HCV. Panel b, Schematic of the model. Panels c and d, correspondence between data and best-fit model for Subject 1. Diamonds, data; solid line, best-fit model; dashed lines, predicted variant contribution to the overall plasma HCV RNA; circles, HCV RNA levels of variants.

