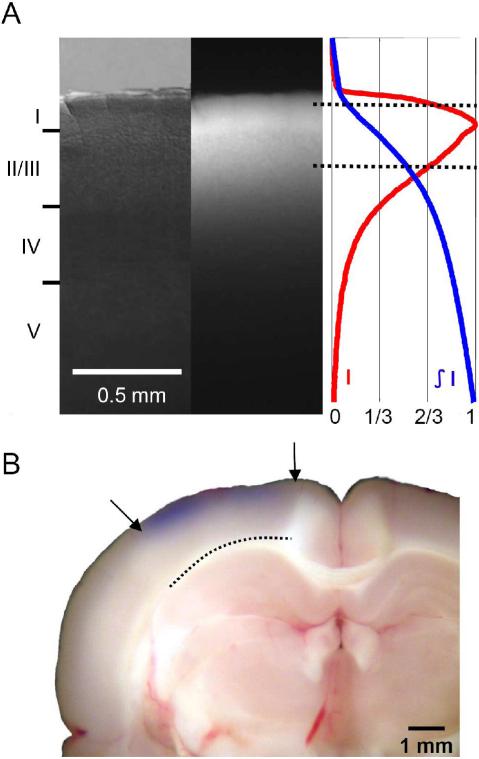
Figure 3. Staining depth.
A. Left, Visible light image of the stained cortex. Middle, fluorescence image from the same cortical section showing distribution of RH1691 staining. Right, fluorescence intensity (red) and integrated fluorescence intensity (blue). Broken lines mark the tissue depth with fluorescent intensity higher than 2/3 of the maximum intensity. B. Photograph of a stained cortical section. Arrows indicate boundary of the cranial window. Broken line indicates the border between gray and white matter. Staining of RH1691 can be seen by eye as a light blue hue.

