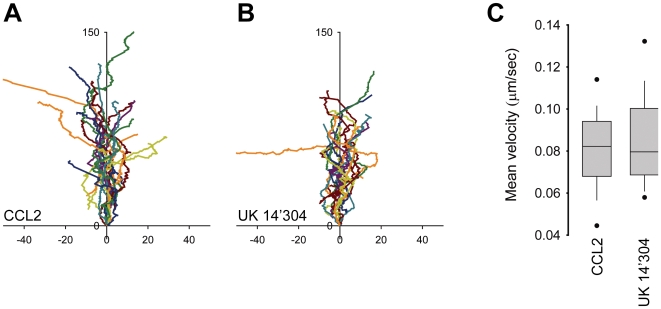
Figure 2. Velocity of THP-1 cells migrating towards different agonists.
THP-1 α2AAR-YFP/CFP cells were plated on glass bottom coverslips coated with poly-D-lysine and Matrigel®. (A) CCL2 (10 nM) and (B) UK 14'304 (1 µM) were dispensed from a micropipette with constant backpressure. Time-lapse videos for each conditions were recorded at 5 sec interval. Tracks were analyzed and plotted aligning their average directional vector with the y-axis (distance in µm). (C) Mean velocity of tracks shown in (A) and (B) were calculated using Metamorph. Data from two independent observations, n = 17 (A) and n = 20 (B).

