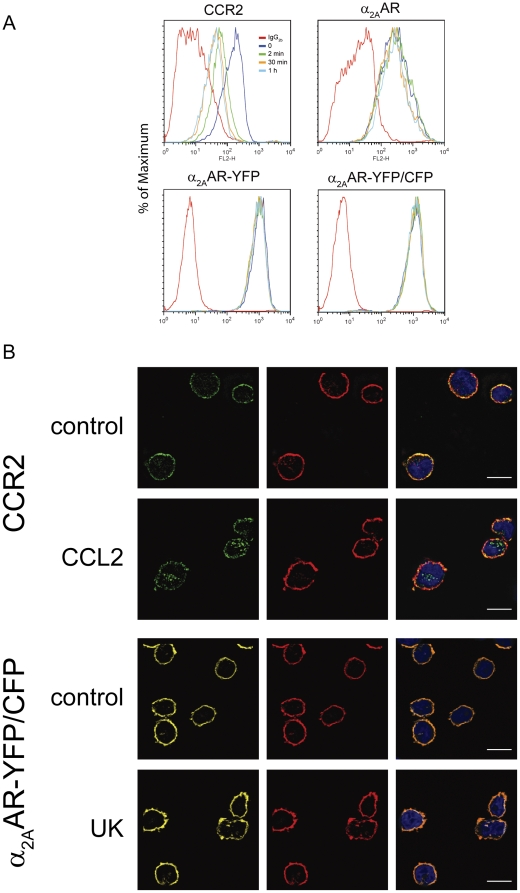
Figure 4. Receptor internalization.
(A) FACS analysis. THP-1 cells were incubated with 200 nM CCL2 and CCR2 expression was measured after the indicated times (upper left). Similarly, THP-1 cells stably transfected with α2AAR (upper right), α2AAR-YFP and α2AAR-YFP/CFP (lower panels) were incubated with 1µM UK 14'304. Red lines represent isotype controls (IgG2b). (B) Confocal microscopy images of wild type THP-1 cells (upper panels) and THP-1 transfected with α2AAR-YFP/CFP (lower panels). Cells were untreated (control) or stimulated with 200 nM CCL2 or 1µM UK14'304 (UK) for 30 min fixed and processed as described in Methods. Receptor expression in wild type (CCR2) was revealed with specific anti-CCR2 (left panel, green). For localization of α2AAR-YFP/CFP the fluorescence of receptor associated YFP was measured (left panel, yellow). The middle panels depict F-actin revealed with phalloidin-Alexa594. Right panels are merged images including nuclear staining (DAPI, blue).

