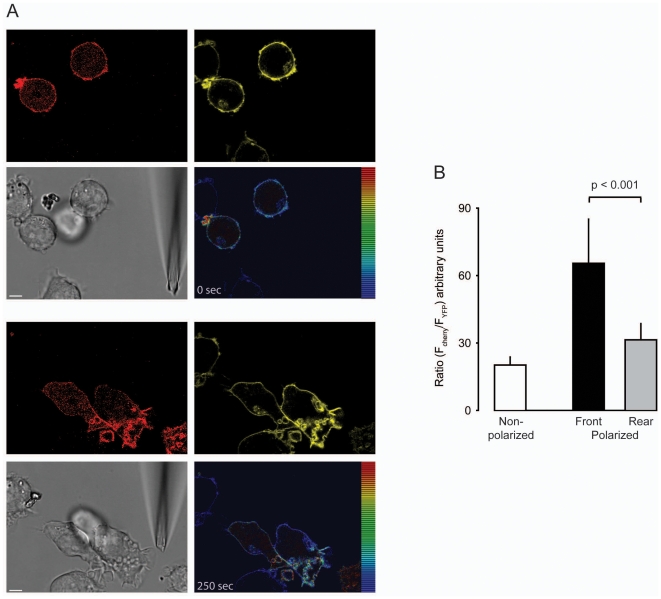
Figure 6. PIP3 formation occurs exclusively at the leading edge.
(A) Selected frames from Movies S3 just after insertion of the micropipette dispensing 300 nM UK 14'304 (0 sec, upper images) and after 5 min (250 sec, lower images). The emission of THP-1 cells transduced with PH-PKB-mCherry (red fluorescence, 594 nm excitation/610–680 nm emission) and expressing α2AAR-YFP/CFP (yellow fluorescence YFP, 514 nm excitation/525–580 nm emission) was recorded contemporaneously (right panels). The false color shows the ratio of red/yellow. Gray, corresponding phase image. The bar in the phase images represents 5 µm. (B) Average ratio-intensity analysis of regions of interest (ROI) measured in resting cells (white bar, non polarized) and polarized cells stimulated with 300 nM UK 14'304 at the front (black) or rear (grey). Data represent the mean values from multiple frames from 3 different cells each from 3 independent experiments. The threshold for data inclusion was set equal in all experiments.

