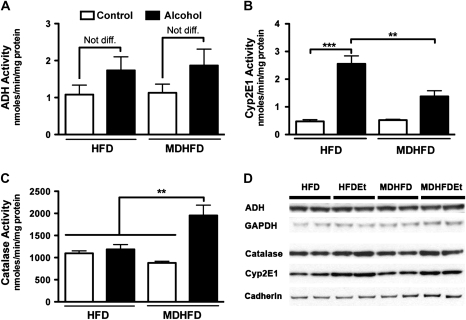
FIG. 3.
Liver alcohol metabolism. Liver activity of (A) ADH, (B) Cyp2e1, and (C) catalase was determined in mice administered a control HFD or MDHFD with or without alcohol for 4 weeks. Asterisks indicate statistically significant (**p < 0.01 and ***p < 0.001) differences using one-way ANOVA followed by Tukey’s post hoc test. N = three to five animals per group. (D) Representative Western blots for ADH, catalase, and Cyp2e1. Glyceraldehyde 3-phosphate dehydrogenase (GAPDH) and cadherin were used for cytosol and membrane protein loading controls, respectively.

