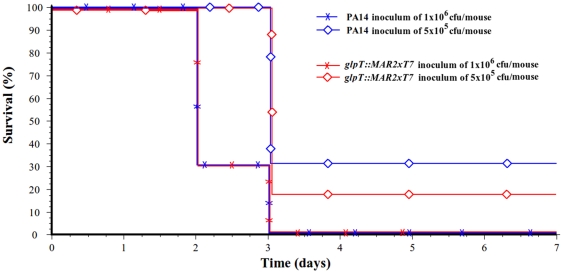
Figure 1. Mortality curves.
Mice were infected with two different inocula of P. aeruginosa PA14 (blue lines) and its mutant glpT::MAR2xT7 derivative (red lines) strains. The Kaplan-Meier analysis failed to detect any significant difference between curves from the same bacterial inoculum (1×10⁶ cell (crosses) and 5×10⁵ cells (diamonds)) (p = 0.81 and p = 0.21, respectively).

