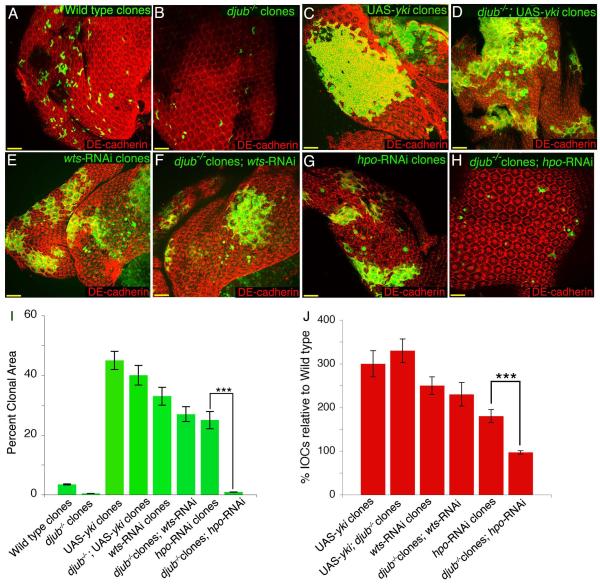
Figure 3. djub is epistatic to hpo based on clonal area and interommatidial cell numbers.
(A-H) Female mid-pupal eyes stained for DE-cadherin (red). Wt, GFP positive MARCM clones (A); djubI MARCM clones (GFP +ve) (B); MARCM clones overexpressing Yki (GFP +ve) (C); MARCM clones mutant for djubI and overexpressing Yki (GFP +ve) (D); MARCM clones expressing wts RNAi (GFP +ve) (E); MARCM clones mutant for djubI and expressing wts RNAi (GFP +ve) (F); MARCM clones expressing hpo RNAi (GFP +ve) (G); MARCM clones mutant for djubI and expressing hpo RNAi (GFP +ve) (H). (I) Quantification of the clonal area (GFP +ve) for each genotype as a percentage of the entire pupal eye area. (J) Quantification of the percent increase of interommatidial cells within the clonal area (GFP +ve) as compared to wild type (set at 100% IOCs) for each genotype. In graphs data are shown as mean percentages +/− standard deviation, with N= 10 for each genotype. (***) Represents p-value ≤ 0.001. Scale bars in (A-H) equal 20μm.

