
Figure 2.
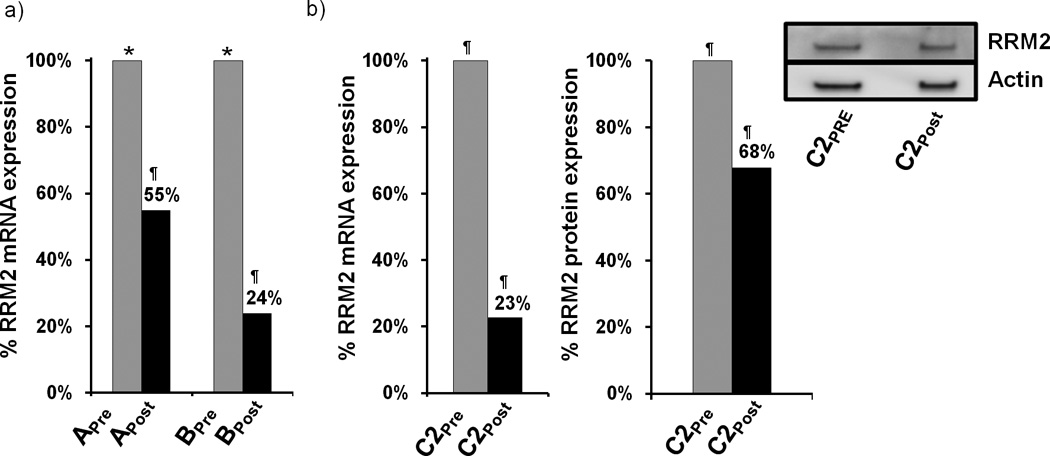
RRM2 mRNA and protein expression in tumor tissue. (a). qRT-PCR analysis of RRM2 mRNA levels in samples from patients A and B before and after dosing. RRM2 mRNA levels are normalized to TBP mRNA levels. Results are presented as percentage of the pre-dosing RRM2/TBP mRNA levels for each patient. (b). qRT-PCR and Western blot analysis of RRM2 protein expression from patient samples C2pre and C2post. Bar graph is average volume of Western blot bands from two independent experiments; one representative blot is pictured. Archived samples are indicated by (*); samples obtained during the trial are indicated by (¶).