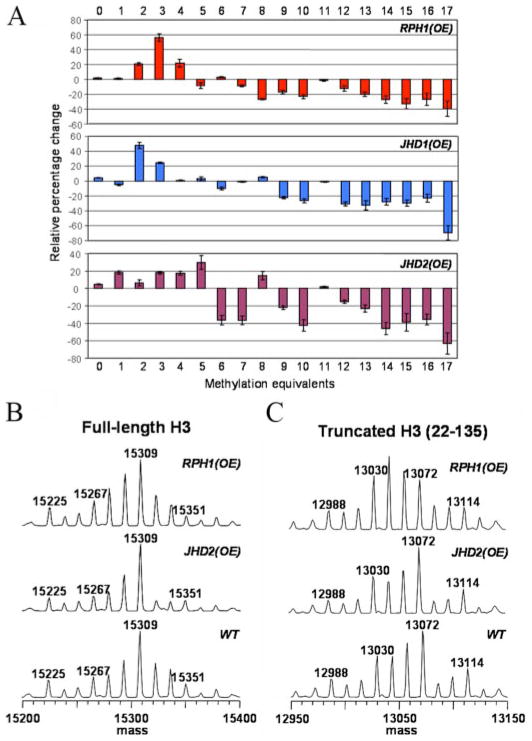
FIGURE 4. MS analyses of overexpression strains.
A, bar plots showing “relative percentage change” of each peak in overexpression strains relative to WT. B, full-length histone H3 MS spectra for WT and the overexpression strains of RPH1 and JHD2. C, corresponding spectra from truncated H3 (residues 22–135).

