Figure 2.
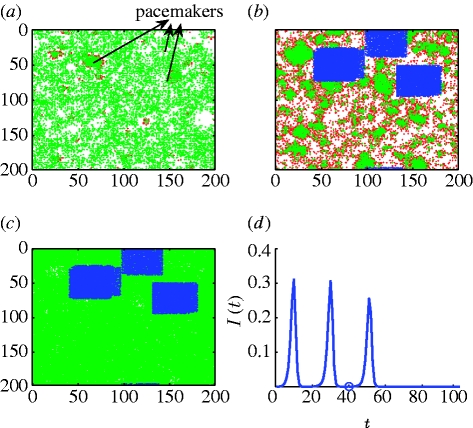
Model simulation of syphilis dynamics (2.1): white, susceptibles; red, infected; green, recovered; k=3, τ I=6 months, τ R=4–8 years, p=0.065, q=0.36, φ=0.2 per year, and μ=0.02 per year. (a) Three pacemakers are seen at time t=25 (12.5 years). (b) Pacemaker areas are vaccinated with a random spread of 86% of each pacemaker area on average, at t=41 (20.5 years), resulting in vaccinating 14.5% of the population. (c) Disease eradication at t=58 (29 years). (d) Time series of the proportion of infectives per 0.5 year. The period of oscillation is T≈10 years. The vaccination time is indicated by an open circle, after which the disease undergoes another smaller peak and reaches complete extinction within less than one period of the disease (8.5 years). For further illustration, see video 2 in the electronic supplementary material.

