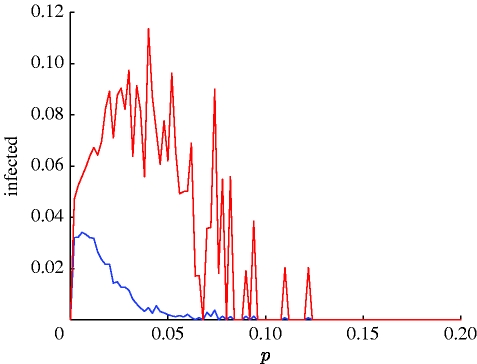
Figure 3.
A bifurcation diagram of the proportion of infectives I for typical syphilis parameter values (as in figure 2) as a function of short cuts parameter p (Δp=0.002, φ=0.2, μ=0). For small p, there is an endemic equilibrium. After a bifurcation point, the dynamics exhibit a limit cycle with radius varying with p. The diagram plots the maximum (red) and minimum (blue) values of I on the cycle. After a second bifurcation value of p, the disease goes to extinction (due to synchronization; for further illustration, see video 3 in the electronic supplementary material).

