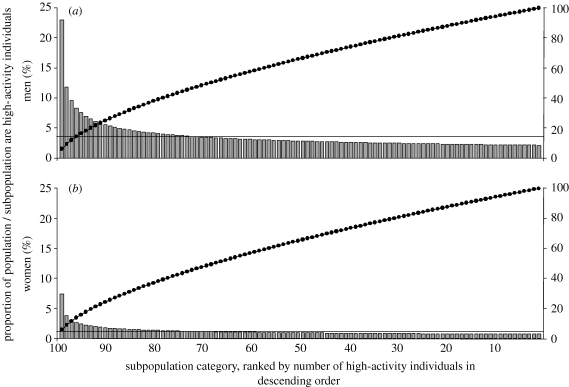
Figure 2.
(a,b) Proportion of subpopulations of high-activity individuals (grey bars), proportion of general population of high- activity individuals (solid horizontal lines) and cumulative proportion of high-activity individuals (filled circles) when using ϕ=0.40. Across all subpopulations, there are fewer women than men in the high-AC, owing to the corresponding gender differences in the proportion of high-activity individuals observed in NATSAL (table 1). Approximately 20% of subpopulations would have a higher proportion of high-activity individuals than the population average, with the remaining subpopulations having slightly less than the population average. Different distributions can be generated, using different values for the distribution parameter, ϕ.

