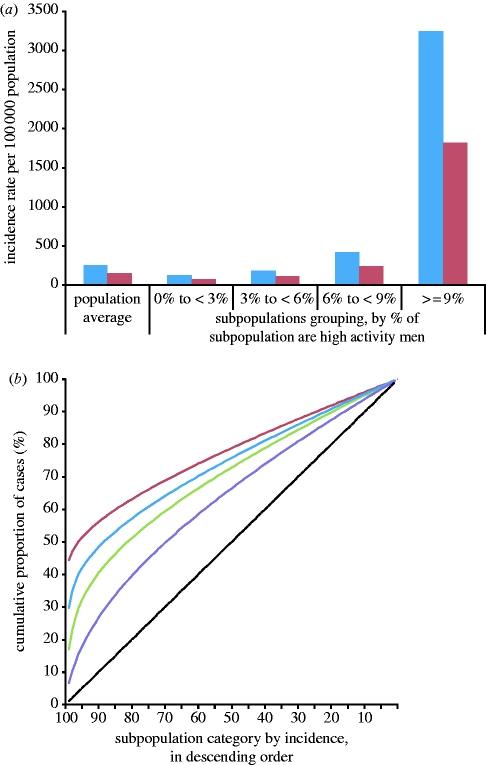
Figure 6.
(a) Modelled incidence rate for subpopulations grouped by the proportion of high-activity men. Parameters are π=0.7 and ϕ=0.4032. Subpopulations with a low proportion of high-activity men (less than 6%) have an incidence rate lower than the population average, whereas the subpopulations with the highest proportion of high-activity men (more than 9%) have an incidence rate more than 10 times the population average (blue bars, men; red bars, women). (b) Lorenz curves using the MP model for gonorrhoea-like parameters, lower and higher transmissibility, and chlamydia-like parameters. π and ϕ are as for (a). A less transmissible disease (15% reduction) would be more highly concentrated in subpopulations that have a higher proportion of high-activity individuals, whereas a more transmissible disease (15% increase) would be more evenly spread out across the subpopulation categories. Chlamydia-like parameters produce a pattern of infections that is spread out more evenly than gonorrhoea (red curve, ↓β M, β F (Gini=0.54); green curve, ↑β M, β F (Gini=0.40); blue curve, gonorrhoea (Gini=0.47); violet curve, chlamydia (Gini=0.26); black dashed line, line of equality).

