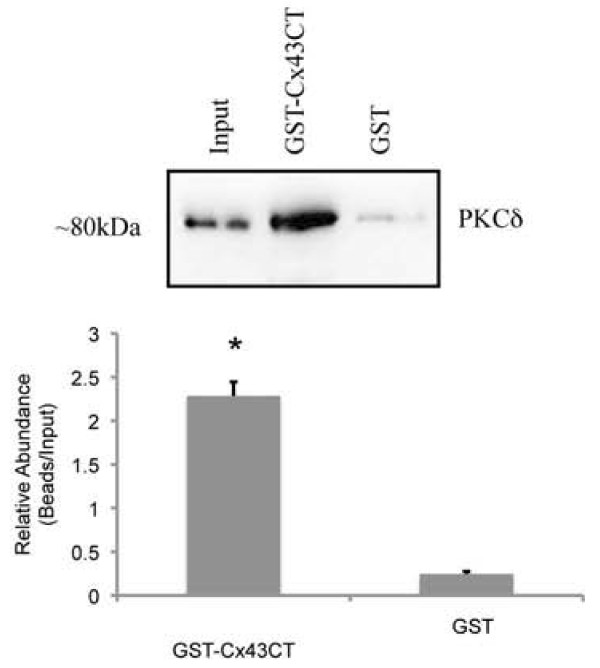
Figure 6.
PKCδ associates with the C-terminal tail of Cx43. GST pull downs were performed using GST- or GST-Cx43CT(241-381) crosslinked beads and whole cell extracts from MC3T3 cells. The input, and bead fractions were analyzed by western blot. The blots were probed with anti-PKCδ antibodies. PKCδ is pulled down by the GST-Cx43CT(241-381) construct but not by GST-crosslinked beads alone. Mean densitometric values of the blots are shown in the accompanying bar graph. The graph reveals the ratio of "pulled-down" PKCδ relative to the PKCδ present in the input fraction from three separate experiments. Error bars indicate standard deviation. An asterisk denotes a p-value <0.05, relative to control.

