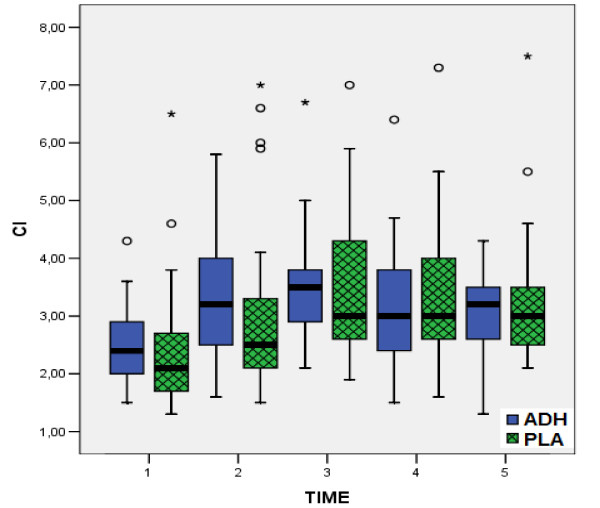
Figure 2.
Cardiac Index during time-points T1 - T5. Distribution of values for cardiac index (CI) during time-points T1 - T5 for group I (vasopressin, in blue boxplots) and group II (placebo, in green boxplots). (median = black line, boxplot = 50% of data set, lines on both sides of the boxplot = dispersion for 99% of values, * = numbers outside of distribution range for 99% of values).

