Figure 3.
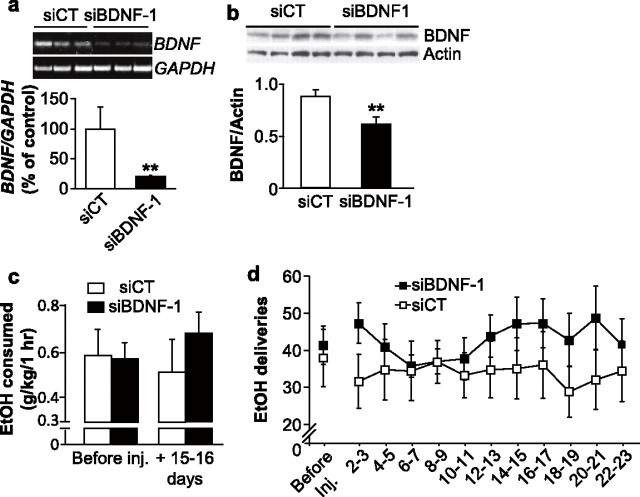
Knockdown of BDNF expression within the DMS does not alter ethanol consumption. a, siBDNF-1 or siCT were stereotaxically injected into the DMS. Fifteen days after the microinjection, DMS were collected for RT-PCR analysis of the BDNF mRNA content. Histograms depict the mean ratios of BDNF/GAPDH ± SEM normalized to BDNF levels obtained from control animals. The insert is a representative image of BDNF mRNA levels from samples collected 15 d after infection by the siCT- or siBDNF-1-expressing virus. A Student's t test revealed a significant difference between the 2 treatments. (n = 3), *p < 0.05. b, Rats were treated as described in a and brain samples were collected 15 d after injection and analyzed by Western blot to determine BDNF protein levels. The insert is a representative image of BDNF protein levels from samples collected 15 d after infection by the siCT- or siBDNF-1-expressing virus. A Student's t test revealed a significant difference between the two treatments. n = 6; **p < 0.01. c, d, Rats were stereotaxically injected with siBDNF-1 or siCT into the DMS 2 months after the beginning of ethanol self-administration training. c, BDNF knockdown within the DMS does not alter the amount of ethanol consumed. The results are expressed as mean ± SEM ethanol consumed (in grams per kilogram). siBDNF-1: n = 7; siCT: n = 5; p values >0.05. d, BDNF knockdown in the DMS does not alter the number of ethanol deliveries. The results are expressed as mean ± SEM ethanol deliveries by blocks of 2 d. siBDNF-1: n = 7; siCT: n = 5.

