Figure 3.
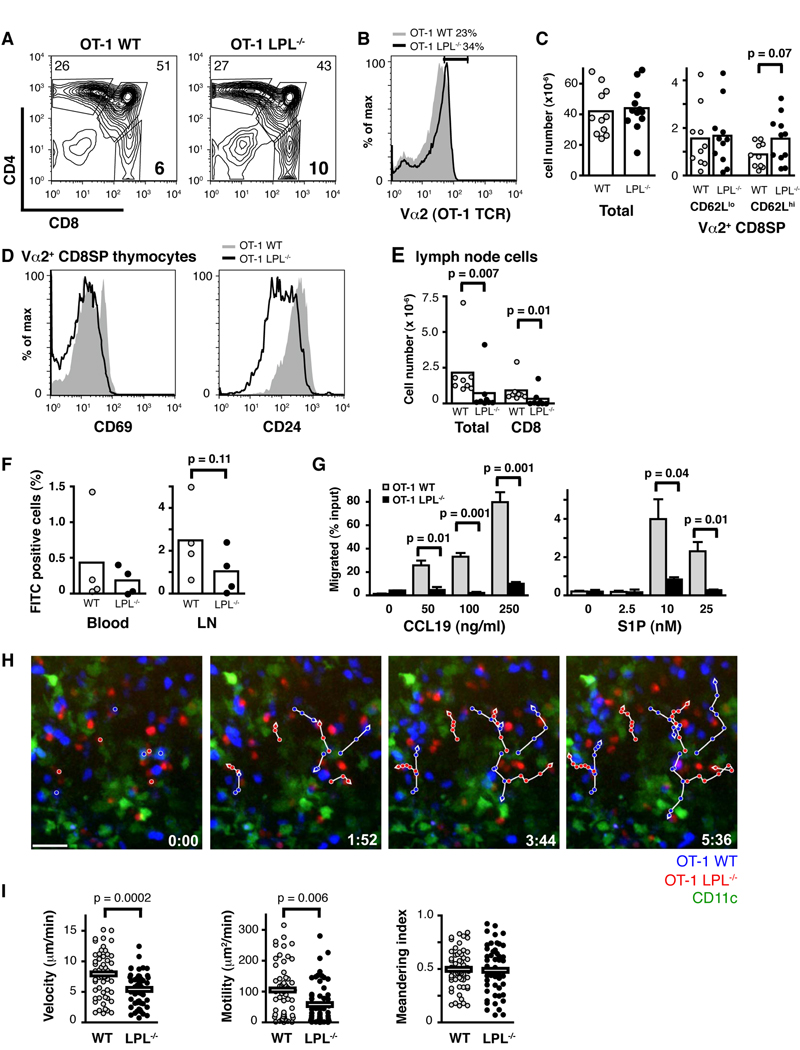
OT-1 LPL−/− mice exhibit similar phenotypic defects as n3.L2 LPL−/− mice and OT-1 LPL−/− lymphocytes exhibit diminished intranodal motility. (A, B) Expression of (A) CD4 and CD8 and (B) Va2 on thymocytes from OT-1 WT (grey) and OT-1 LPL−/− mice (solid line). (C) Number of total, CD62Llow Vα2high CD8SP and CD62Lhigh Vα2high CD8SP thymocytes from OT-1 WT (grey, n=11 or 10) and OT-1 LPL−/− (filled, n =12 or 11) mice. Each symbol represents value from an individual mouse, p value from unpaired t-test. (D) Expression of CD69 and CD24 on Vα2high CD8SP thymocytes from OT-1 WT (grey) and OT-1 LPL−/− (solid line) mice. (A, B, C, D) Data from at least 6 independent experiments. (E) Numbers of total and CD8+ T cells from lymph nodes of OT-1 WT (grey, n = 8) and OT-1 LPL−/− (filled, n = 8) mice analyzed in 4 independent experiments, p value determined using Mann-Whitney. (F) Normalized percentage of FITC-labeled Vα2 CD8+ cells recovered from peripheral blood and lymph nodes of OT-1 WT and OT-1 LPL−/− mice 48 hrs after intrathymic FITC injection. Each symbol represents value from individual mouse; data from 4 independent experiments, p value determined using Mann-Whitney test. (G) Vα2 CD8SP thymocytes from OT-1 LPL−/− mice did not migrate efficiently in transwell assays towards CCL19 or S1P. Data shown are mean ± S.E.M. of duplicate or triplicate samples with p values determined by unpaired t-test; representative of 2 independent experiments. (H) Two-photon time-lapse image sequences of CD8+ OT-1 WT (blue) and CD8+ OT-1 LPL−/− (red) cells in naive lymph nodes 2 h after injection into CD11c-YFP mice. Dendritic cells appear green. Representative cell tracks are shown (white lines). Time stamp in lower right-hand corners. Scale bar represents 20 µm. Corresponds with supplemental video. (I) Velocity (mean OT-1 WT, 7.8 µm/min; mean OT-1 LPL−/−, 5.3 µm/min), motility (mean OT-1 WT, 104 µm2/min; mean OT-1 LPL−/−, 61 µm2/min) and meandering index of CD8+ cells from OT-1 WT (grey circles, n= 56) and OT-1 LPL−/− (filled circles, n=55) mice. Each point represents a single cell tracked for a minimum of 8 frames. Mean of each population is indicated, with p values determined by Mann-Whitney test. Data pooled from two independent experiments.

