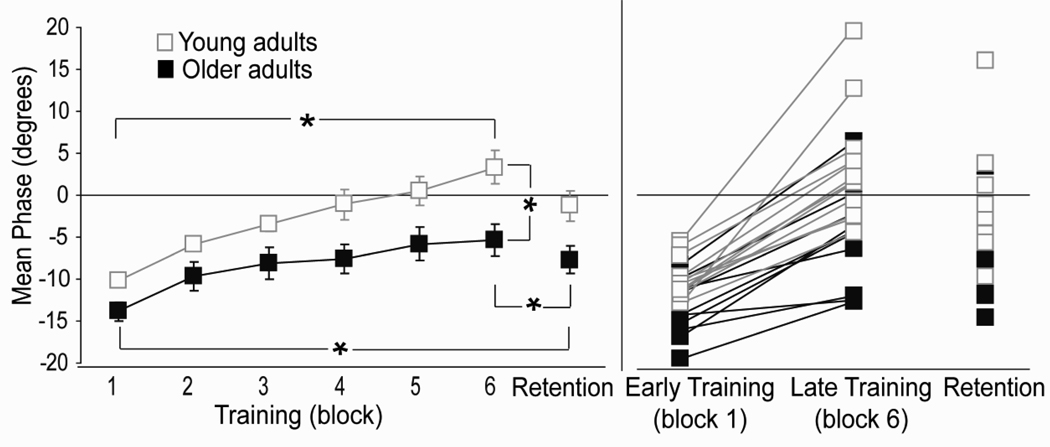
Fig. 2.
Group (left) and individual (right) changes in COM phase during training and retention testing. Positive values represent COM phase lead relative to platform motion. Error bars represent standard error of the mean. Asterisks indicate main effects significant at p<0.05. Young adult data taken from Van Ooteghem et al. (2008)

