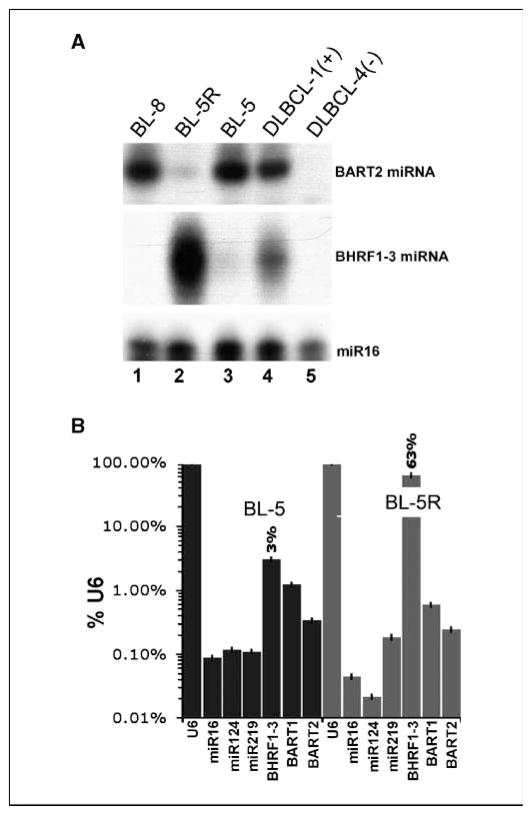
Figure 2.
Differential expression of BHRF1-3 and BART2 miRNAs in BL cell lines. A, RPA analysis of BHRF1-3 and BART2 miRNA expression in BL lines BL-8 and BL-5, a lymphoblastoid derivative BL-5R, an EBV+ DLBCL-1(+), and an EBV− DLBCL-4(−). Expression of a cellular miRNA, miR16, was analyzed as loading control. B, real-time QPCR analysis of EBV miRNA expression in BL-5 and BL-5R cells. Bars, relative level of miRNAs in percentage to U6 RNA on the vertical axis on a logarithmic scale. Expression of EBV miRNAs (BHRF1-3, BART1, and BART2) and expression of cellular miRNAs (miR16, miR124, and miR219) were analyzed.

