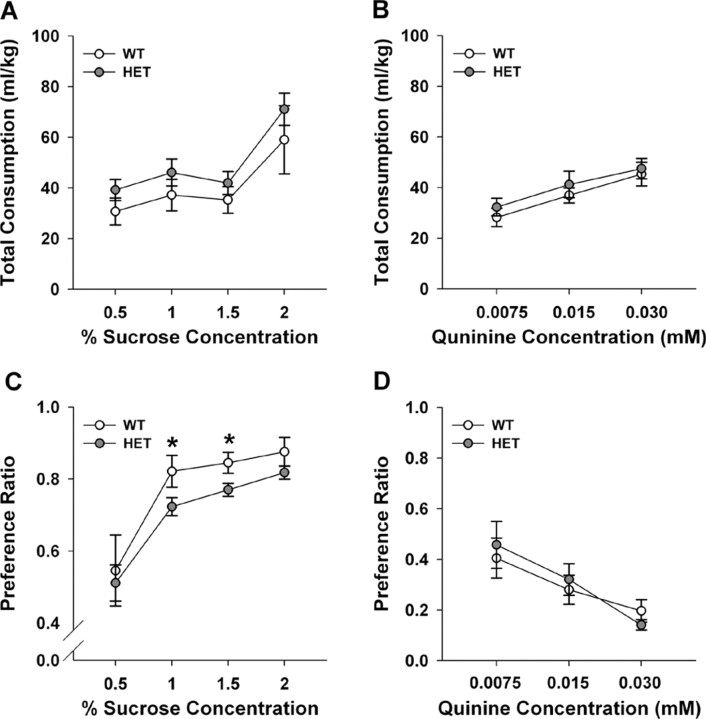
Figure 2.
Responses of WT and Vmat2 HET mice in an anhedonia test. A, Total fluid consumption of water and sucrose solutions across testing. B, Total fluid consumption of water and quinine solutions across testing. C, Preferences for sucrose solutions over that for water. D, Preferences for quinine solutions over that for water. Preference was determined by dividing the volume of sucrose or quinine consumed by the total liquid consumption. *p < 0.05 compared with WT mice; n = 7–10 mice/genotype.

