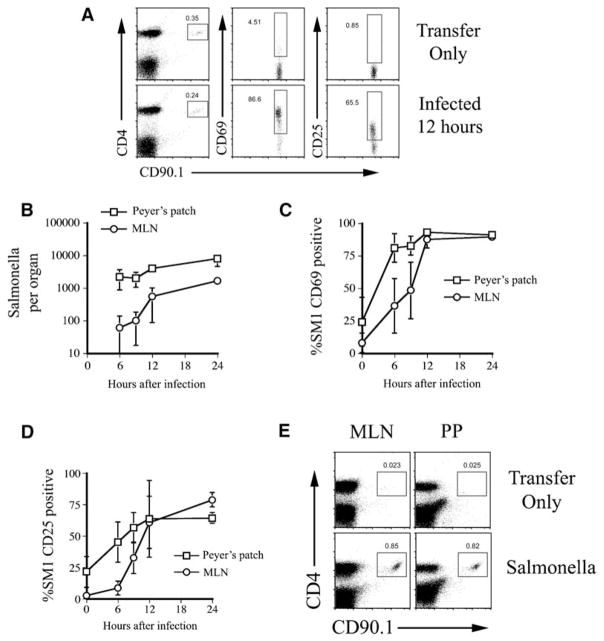
Figure 1. Salmonella-Specific T Cells Are Rapidly Activated in Mucosal Tissues.
C57BL/6 mice were adoptively transferred with SM1 T cells and infected orally with Salmonella.
(A) Plots show representative MLNs from uninfected (Transfer Only) and infected (Infected) mice 12 hr later. Left plots show the box gate for detection of SM1 T cells, and the other plots show the expression of activation markers after gating only on SM1 T cells. Numbers show the percentage of cells within the boxed gate. Data are similar to three mice per group and three other separate experiments.
(B–D) PPs and MLNs were harvested at various times after oral infection. Plots show (B) bacterial burden, percentage of (C) CD69+, and (D) CD25+ SM1 T cells (using similar gates to those in [A]) and show mean ± SD of four mice per time point. Please note logarithmic scale in (B).
(E) PPs and MLNs were harvested 3 days after oral infection. Plots show SM1 T cell detection in each tissue of uninfected (Transfer Only) or infected (Salmonella) mice and are representative of three similar mice per group and three separate experiments.

