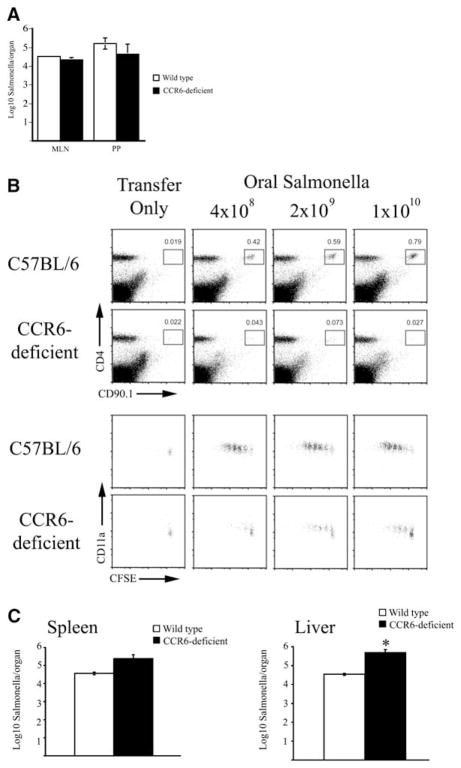
Figure 7. Alteration of Infectious Dose Does Not Affect the Requirement for CCR6 in T Cell Activation.
(A) Wild-type and CCR6-deficient mice were orally infected with 1 × 10¹⁰ Salmonella, and the number of viable bacteria examined in the PPs and MLNs 3 days later. Plots show the mean and SD of the absolute number of Salmonella per MLN or combined PPs per mouse. Data points represent three mice per group and are similar to two other experiments.
(B) Wild-type or CCR6-deficient mice were adoptively transferred with SM1 T cells, infected orally with 4 × 10⁸–1 × 10¹⁰ Salmonella, and PPs harvested 3 days later. Plots show the percentage of SM1 T cells in the PPs (top plots) or CD11a expression and CFSE-dye dilution after gating on PP SM1 T cells (bottom plots). Data are similar to three to four mice per group and two individual experiments.
(C) Wild-type and CCR6-deficient mice were orally infected with 1 × 10¹⁰ Salmonella, and the number of viable bacteria examined in the spleens and liver 3 days later. Plots show the mean and SD per organ of 15 mice per group, and asterisk indicates statistically significant difference between data sets.

