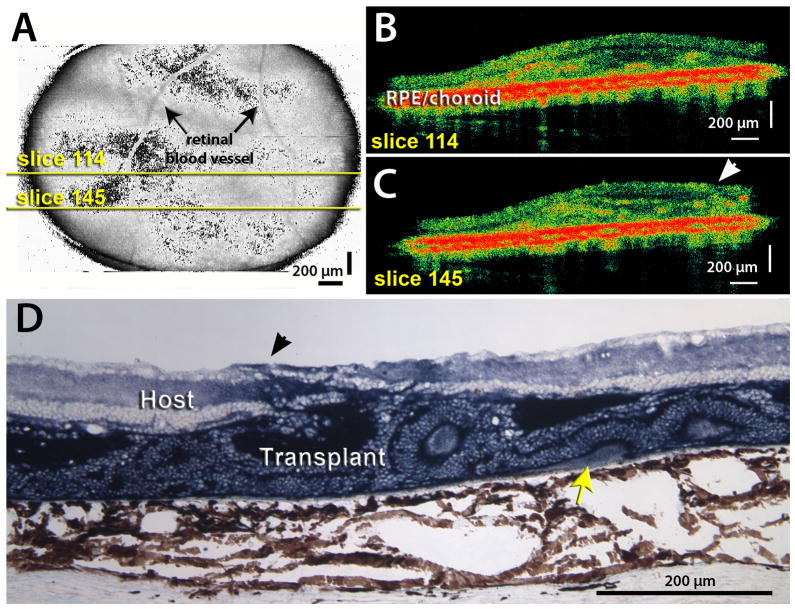
Figure 3. Example of rosetted transplant.
A) Fundus projection obtained from an OCT scan of a retinal transplant area at 2.1 month post surgery, rat age 3.2 months. Yellow lines indicate positions of scans shown in B). The optic disc is outside the scan area where the blood vessels would converge. B) C) Examples of 2 slices through graft. Rosettes are indicated by highly reflective red dots in the OCT image; arrowhead in C) indicates an area where the transplant extends through the host retina into the vitreous. The interface between host and transplant is indicated by a thin dark line. D) Histology of same transplant at 2.5 months post surgery, oriented with the ganglion cell layer up and the RPE/choroid down. Transplant stained dark blue for donor hPAP marker. Arrowhead indicates penetration of transplant (blue stain) through host retina into vitreous. Most of the transplant is filled with rosettes (circular arrangement of photoreceptors). Note that a small area of correct transplant lamination with outer segments (yellow arrow) was missed in the OCT. Scale bars = 200 μm.

