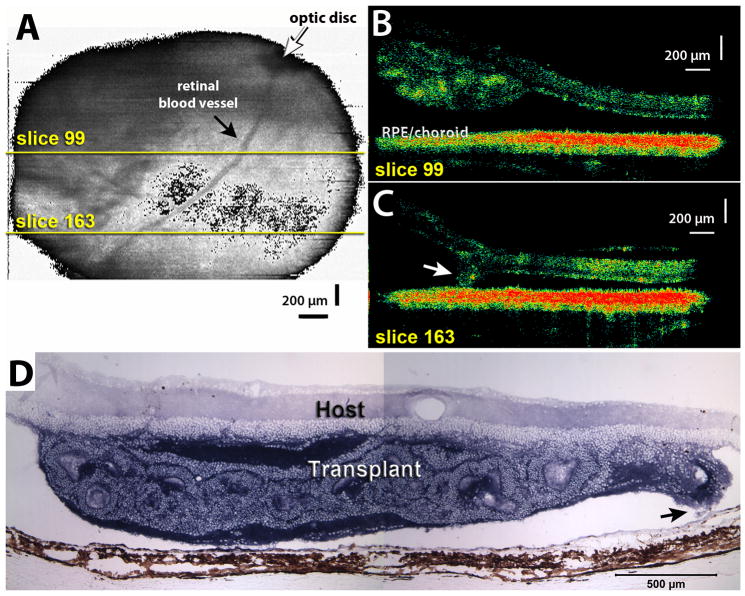
Figure 5. Example of retinal detachment.
A) Fundus projection obtained from an OCT scan of a retinal transplant area at 0.9 month post surgery (rat age 1.9 months). Yellow lines indicate positions of scans shown in B–C). B–C) Examples of 2 slices through graft. Slice 99 (B) indicates a rosetted transplant attached to a detached host retina (black space between transplant and host RPE/choroid), slice 163 (C) shows an area where the edge of the transplant (arrow) is in contact with the host RPE. D) Histology of same transplant at 1 month post surgery, confirming the retinal detachment. The transplant exhibits rosettes only. Arrow indicates area where tip of transplant in attached to RPE (scan area of C). Scale bars = 200 μm (A,B), 500 μm (C).

