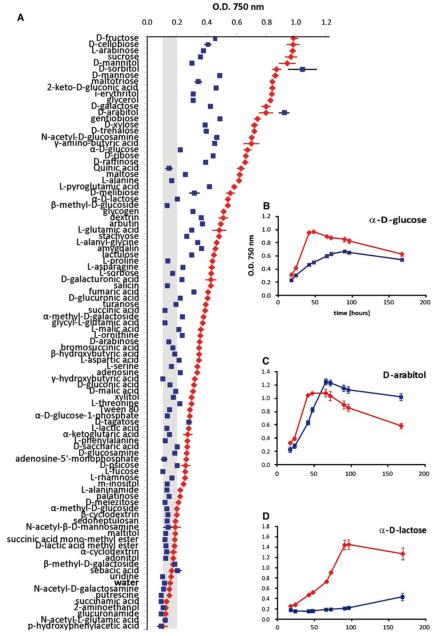
Fig. 7.
(a) Analysis of biomass formation of the T. atroviride gpr1-silenced mutant gpr1sil-8 (filled square) in comparison to the parental strain (filled diamond) after incubation for 66 h on 95 carbon sources and water using the BIOLOG microplate assay. (b–d) Growth curves of T. atroviride parental strain (filled diamond) and the gpr1-silenced mutant (filled square) on some individual carbon sources determined after 18, 24, 42, 48, 66, 72, 96 and 168 h of incubation. The values given represent the average of three analyses

