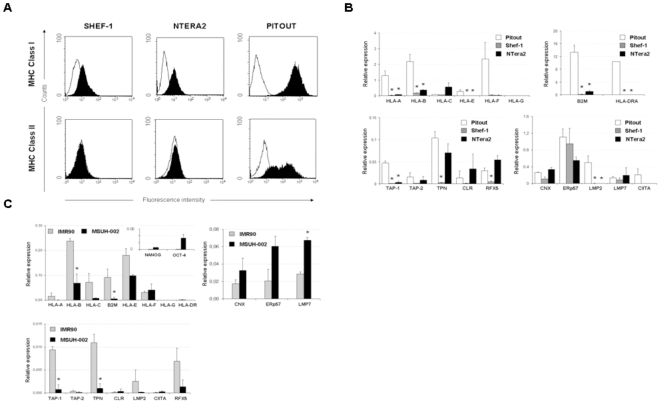
Figure 1. Expression of MHC class I and class II, and the molecules involved in the APM in undifferentiated Shef-1 and NT2 cell lines.
A) The expression of HLA class I and class II was determined by flow cytometry in undifferentiated Shef-1 and NT2 cell lines. The EBV-transformed B cell line Pitout, which expresses class I and class II, was used as positive control. HLA class I and class II were stained with an anti-pan HLA class I (anti-HLA-ABC mAb)-FITC and HLA-DR-PerCP respectively. Viable cells were gated using 7AAD staining. Thin lines show cells treated with isotype control and black histograms represent positive cells. Similar results were obtained from four independent experiments. B) Quantitative-PCR analysis of classical MHC class I molecules (HLA-A,–B and -C), non-classical MHC molecules (HLA-E,-F and –G), antigen processing molecules (TAP-1, TAP-2, TPN, CNX, CLR, ERp57, LMP2, LMP7) and the transcription factors RFX5 and CIITA in undifferentiated Shef-1 and NT2 cells, compared to the control, Pitout cell line. mRNA levels were normalized to GADPH mRNA. C) Quantitative-PCR analysis of the MHC genes and APM components in iPSCs and parental IMR90 fibroblast line. The upper right histogram has shown the expression levels of the pluripotent transcription factors Nanog and Oct-4 in fibroblast and iPSCs. mRNA levels were normalized to GADPH mRNA. The results of quantitative PCR are represented as means ± SD from triplicate experiments. * P<0.05.

