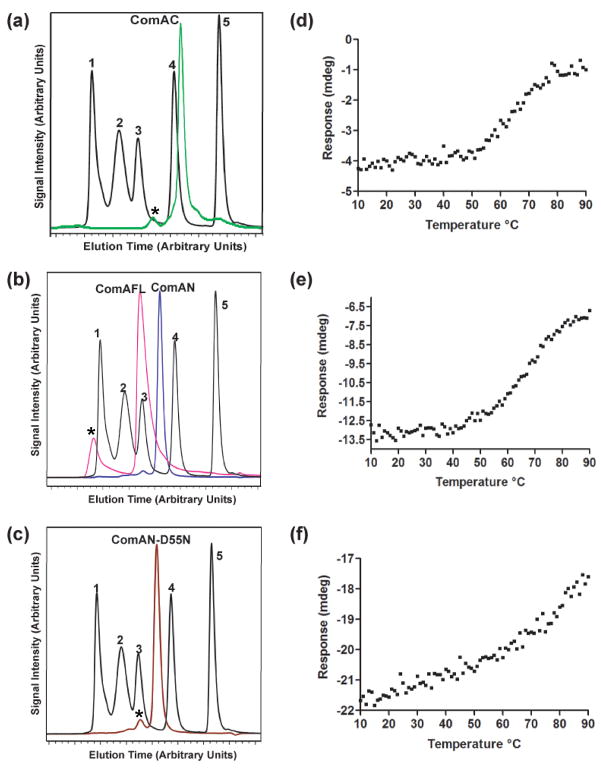
Figure 2.
Characterization of ComA. Size exclusion chromatography of: A) ComAC (green), B) ComAFL (pink), ComAN (blue), and C) ComAN-D55N (brown). Standards are in black: 1 denotes thyroglobulin (670 kDa), 2 denotes bovine γ-globulin (158 kDa), 3 denotes chicken ovalbumin (44 kDa), 4 denotes equine myoglobin (17.5 kDa), and 5 denotes vitamin B12 (1,350 Da). *Identifies peaks resulting from aggregation at the highest concentration. Thermal denaturation profiles of ComA: D) ComAC E) ComAFL, and F) ComAN, by monitoring the A222 nm over a temperature range of 10 °C to 90 °C.

