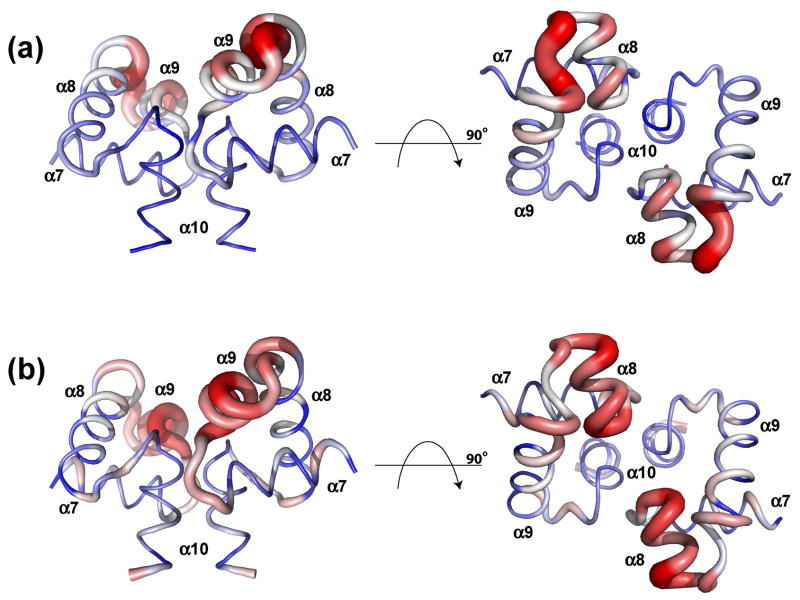
Figure 7.
Calculation of Cα r.m.s.d. variation of ComAC and its homologues in their DNA bound state. The Cα r.m.s.d. differences calculated between ComAC and A) NarLC, B) DosRC. Blue represents the lowest difference, white intermediate and red the greatest difference in addition to the increasing size of the cartoon.

